Files
After purchasing Mapplic - Custom Interactive Map jQuery Plugin, a ZIP archive file can be downloaded from CodeCanyon. This archive contains the following two folders:
doc - contains a detailed user guide and an SVG map tutorial
html - contains the plugin with the required libraries and all the built-in and demo maps
Update
Mapplic comes with free, lifetime updates. Customers can always download the latest version from the CodeCanyon Downloads Page (must be logged in). We will send out notifications on every major update.
Getting Started
Why do you need these .json files?
Mapplic separetes map graphics from map data. Graphics are the actual image or vector files, while map data describes everything what's on the map: categories, floors and landmarks.
We came up with this unique solution to prevent embedding map data into html or javascript files. Don't worry, these are simple and raw text files, editable with any txt editor.
Setting up your first map
The easiest way to get started with the plugin is editing one of the included demo .html and .json files. For example, if you need a United States map, try editing the attributes found in usa.json and see what happens. The next step could be adding a new landmark by copying an existing one and
In case you want to use Mapplic with an existing project, you must include the following styles CSS and JavaScript files:
<link rel="stylesheet" type="text/css" href="mapplic/mapplic.css">

<script type="text/javascript" src="js/jquery.min.js"></script>
<script type="text/javascript" src="js/hammer.min.js"></script>
<script type="text/javascript" src="js/jquery.easing.js"></script>
<script type="text/javascript" src="js/jquery.mousewheel.js"></script>
<script type="text/javascript" src="mapplic/mapplic.js"></script>
The plugin uses AJAX for loading map data. This is not allowed in some browsers for local files due to security reasons and you may get this error message: "Data file missing or invalid". The solution is using a web server, it can be either a hosted web server environment or a local solution like XAMPP or MAMP.
Options
As any jQuery plugin, Mapplic has to be called in the page at some point. The function is mapplic() and it takes a list of optional settings as the first parameter.
$('#map').mapplic({
	source: 'map-data.json',
	height: 480,
	minimap: false,
	sidebar: true,
	hovertip: true,
	developer: false,
	maxscale: 2
});
Full List of Options
source ('location.json') - path to the data JSON file or an inline JSON object. This path is relative to the HTML file. To use the default value, the data file must be called 'locations.json' and it should be in the same folder with the index file. Use inline JSON objects if the application is not running on a web server (see canada.html for example).
landmark (null) - enables Landmark Mode: the map will be focused to the location with ID set as value by default.
mapfill (false) - the map fill the container if true, otherwise the map will fit into the container, as the default behavior.
height (420) - height of the plugin in pixels. Width will be the available horizontal space.
markers (true) - can be used to disable dynamic markers (pins) on the map.
minimap (true) - enable/disable minimap. Paths to minimap images are set in the .json file.
sidebar (true) - enable/disable sidebar, containing search field and the list of locations.
search (true) - enable/disable search field. It only has meaning if the sidebar is enabled.
deeplinking (true) - enable/disable deeplinking feature: every location has it's own URL.
clearbutton (true) - show/hide clear button (bottom left corner of the map).
zoombuttons (true) - show/hide zoom (+/-) buttons (bottom left corner of the map).
hovertip (true) - enable/disable hover tooltip showing the landmarks' title.
smartip (true) - enable/disable smart (always visible) tooltip.
fullscreen (false) - show/hide fullscreen button (top left corner of the map).
developer (false) - enable/disable developer mode: displaying coordinates of the cursor.
maxscale (4) - float value indicating the maximum zoom level. For example, for a file with 600x400 dimensions when it fits, and the limit is set to 2, the maximum zoom will be 1200x800.
skin ('') - apply a user interface skin. Currently the only available option is 'mapplic-dark'.
zoom (true) - enable/disable zoom feature. When disabled, the map will automatically zoom out when tooltips are closed.
Data Structure
Mapplic has its own clean JSON data structure. It is simple text, you can use any text editor and no coding knowledge is required! Learning through examples is the easiest, if you need something that can be found in the previews, open the demo .json and see how it is done.
{
  "mapwidth": "2000",
  "mapheight": "2000",
  "categories": [
    {
      "id": "furniture",
      "title": "Furniture",
      "color": "#4cd3b8",
      "show": "false"
    },
    {
      "id": "rooms",
      "title": "Rooms",
      "color": "#63aa9c",
      "show": "true"
    }
  ],
  "levels": [
    {
      "id": "lower",
      "name": "0",
      "title": "Lower floor",
      "map": "images/apartment/lower.jpg",
      "minimap": "images/apartment/lower-small.jpg",
      "locations": [
        {
          "id": "coffeetable",
          "title": "Coffee Table",
          "about": "The best place to spend the afternoon",
          "description": "This is an awesome coffee table.",
          "category": "furniture",
          "link": "http://codecanyon.net/user/sekler?ref=sekler",
          "x": "0.2050",
          "y": "0.4660",
          "zoom": "3"
        }
      ]
    }
  ]
}
The plugin will not work if your JSON is invalid. A validator like this one will tell you what's wrong. Common mistakes are:
having a comma after the last element of an array ([{},])
not using quotation marks ("") for attribute keys and/or values
Attributes
Below you can find the full list of attributes. Each attribute not marked as (optional) is required!
mapwidth - width of the map file(s) in pixels.
mapheight - height of the map file(s) in pixels.
-
categories []
(optional) - list of categories. It can be completely skipped if there is no need for categories.id - unique ID of the category.
title - title of the category, displayed in the sidebar.
icon (optional) - path to an icon file, displayed in the sidebar.
color (optional) - color of the category, the default color is gray.
show (optional) - default value is true. Setting it to false will make the category collapsed by default.
-
levels [] - list of levels (floors). At least one level is required for a working map.
id - unique ID of the level.
title - title of the level, displayed on the level switcher (top left).
map - path to map file of the level, relative to the HTML file.
minimap (optional) - path to minimap file of the level, relative to the HTML file. The minimap must be enabled in the Options to work.
locations [] - list of locations on the level.
id - unique ID of the location. This will appear in the deeplinking URL and you can link a location with an SVG element using this field.
title - title of location, displayed on sidebar and tooltip.
about (optional) - short text displayed in the sidebar.
description (optional) - short description displayed in the tooltip, html elements supported.
pin (optional) - type of the pin. This string will be added as the pin's CSS class, so you can add your own styles. Red is the default value. Built-in pins are orange, yellow, green, blue, purple, circular, transparent, iconpin. Set it to hidden for no pin. For icon pins you also have to add "fa" and "fa-[icon-name]". You can find the available icon list here.
fill (optional) - fill color of the SVG shape or pin (circular and transparent types)
category (optional) - ID of the category the location belongs to. There must be a category with this ID.
link - an internal or external link assigned to the location. The action attribute defines what to do with this link. A "More" button appears in the tooltip by default.
action (optional) - the action to perform when location is clicked. It can be open-link, to automatically redirect ot the URL defined in link attribute, open-link-new-tab to open it in a new tab or none for zooming only.
thumbnail (optional) - path to the thumbnail image, relative to the HTML file.
x - x position of the location. See X and Y coordinates for more information.
y - y position of the location. See X and Y coordinates for more information.
zoom - target zoom level when the location is focused. The default value is 4.
X and Y coordinates
Set the developer option to true, a small box containing the cursors positon will appear at the top of the map.
Move your cursor over the desired location and copy the displayed x and y coordinates into your data file
Creating SVG Map
Creating a new map or making an existing one compatible with Mapplic requires a few simple steps. It's nothing more than a few simple naming and grouping convetions.
In this tutorial we are using Adobe Illustrator CC, however older version of Illustrator can also be used. Inkscape is a free alternative for creating vector graphics, but it requires different steps and due to its popularity, we are focusing on Adobe Illustrator in this tutorial.
Walkthrough
The above video is a walkthrough of creating a simple SVG maps with interactive elements. In the next section each step is explained in detail.
1 Creating New Document
Open Illustrator and create a New Document. Give your document a name, make sure the Units are set to Pixels and choose the desired dimensions (width and height).
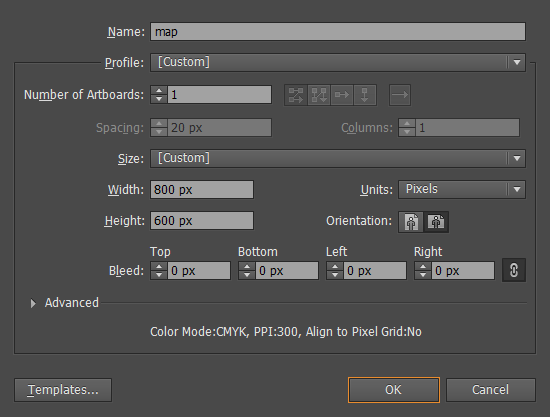
Press OK, and an empty, white canvas will appear.
2 Drawing the map
The next step would be the actual drawing of the map. You can always add or edit content, so if it's your first time creating a map experiment with a few simple shapes, you can add complex drawings later.
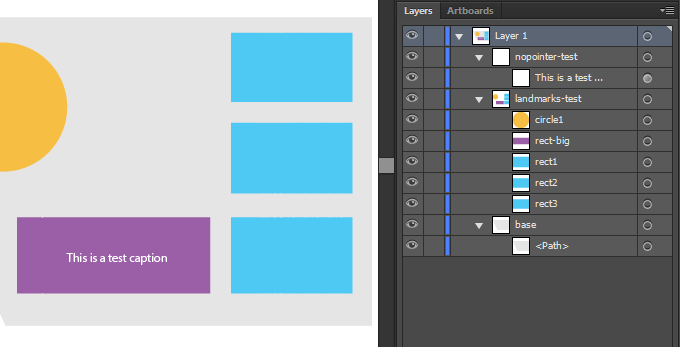
The correct grouping and naming of the SVG elements is very important, it is used by the plugin to identify elements with different behavior (for example the interactive elements of the map). For creating groups and naming elements use the Layers tool (F7). There are three types of elements:
Common elements (environment)
The first type is the common elements. These will be the elements on the map without interactivity. You are free to draw all kinds of shapes or add images without any naming or grouping conventions. In general the environment is non interactive so we're using common elements. On the walkthrough video this would be the base.
Interactive elements (landmarks)
We will refer to the interactive elements of the map as "landmarks". Every named, direct child of a group with a name starting with landmarks is considered a landmark. So create interactive elements as follows.
-
Create a new group. The name of the group MUST start with "landmarks" and cannot contain spaces.
Correct: landmarks-test, landmarks-deparment-shops, landmarks-lots
Incorrect: landmark, test_landmarks, lndmarklots
-
Select the shapes you want to make interactive and move them to the first level of the newly created group, make sure there are no nested groups.
-
Name each landmark with a unique identifier. The names cannot contain spaces! When you will be adding your landmark in your .json data file, you will have to use the same ID for the landmark. The landmark data and the SVG shape are connected through this ID so make sure it's UNIQUE!
Nopointer elements (logos/captions)
Sometimes an overlaying element might block the interactivity, for example logos or captions over a landmark. This is where nopointer elements come handy. If an element's, or its parent's (direct or indirect) name starts with nopointer, it will be ignored by the mouse pointer.
3 Saving the Map
To save your map as .svg, use the File > Save As option, select the type SVG (*.SVG).
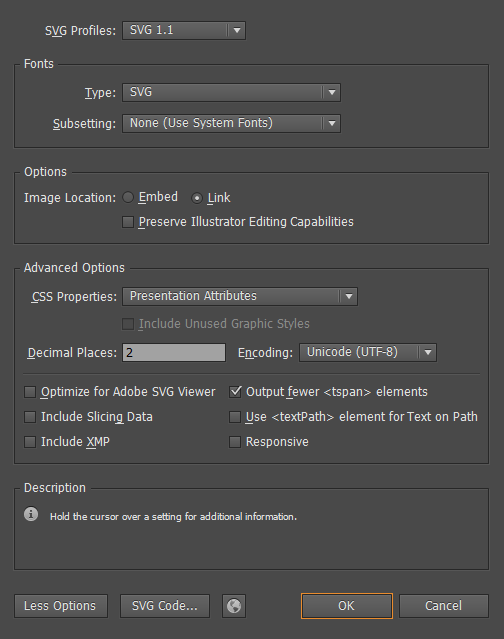
It is advised to:
set at least 2 for the decimal places
link images (if there is any) instad of embedding
With some basic Illustrator skills, anyone can create a Mapplic compatible interactive vector map within minutes. If you have any further questions please get in touch using this contact form.
Customization
In some cases your project might require changes not possible through simple options or data structure settings. In the following, we will go through a few commonly requested modifications. If you need further customization, feel free to get in touch, we are available for custom work.
There are three files you might need to edit: js/mapplic.js, css/mapplic.css and css/map.css. To make your CSS changes future proof, it's strongly advised to write the changes in css/map.css, even if the selector already exists in the other CSS file.
Resizing the Minimap
By default, the minimap has a width of 140 pixels. To resize it, we have to alter the width, the height will be adjusted automatically maintaining the aspect ratio. It can be resized using the following style:
.mapplic-minimap {
	width: 200px;
}
Relocating Components
You might want to relocate the UI elements over the map (minimap, level switcher, clear button, fullscreen button, zoom buttons). Use the top/right/bottom/left attributes to move them. For example, if we wanted to move the level switcher to the top-left corner:
.mapplic-levels {
	top: 0;
	left: 0;
}
Making the link open in a new Tab/Window
Use text editor's search feature to find the first line, and replace it with the second:
// find this:
this.link = $('<a>More</a>').addClass('mapplic-tooltip-link').attr('href', '#').hide().appendTo(this.el);

// replace with this:
this.link = $('<a>More</a>').addClass('mapplic-tooltip-link').attr('href', '#').attr('target', '_blank').hide().appendTo(this.el);
Others
Thank you for reading the docs carefully. In case you found anything wrong or incomplete please let us know. We are working hard to provide a cheap, yet premium quality custom map solution.

If you liked the plugin please consider rating it with 5 stars on CodeCanyon.
Credits
jQuery Library
jQuery Mouse Wheel Plugin - mousewheel support
jQuery Easing Plugin - easing animations
Hammer.js - pinch zoom
FontAwesome - icon fonts
Changelog
Version 3.1 - May 27th, 2015
- SMART TOOLTIP - tooltip now repositions itself and it's always visible
- 7 new built in maps: Continents, Australia, Italy, Switzerland, Russia, China, Brazil
- inline JSON support
- possibility to link floors
- introdution of UI themes
- tooltip scroll bug fixed
- small CSS fixes
Version 3.0 - January 31st, 2015
- 7 built in maps: World, Europe, USA, Canada, France, Germany, England
- new generation of interactive SVG maps (old method still supported)
- deeplinking engine rewritten (hash > query parameter)
- zoom buttons (+/-) added
- map in container: fit or fill
- mobile optimiztaion
- retina support
- hammer.js updated to version 2.0.4
- new pin types added
- fontawesome icons for pins
- drag&drop fix: now clickable areas can be dragged as well without activating them
- small design changes
Version 2.0.1 - August 2nd, 2014
- fullscreen bug fixed
- IE9 tooltip close/clear button bug fixed
Version 2.0 - June 6th, 2014
- PINCH ZOOM added for touch devices
- hybrid mode added (now you can have clickable shapes and pins on the same map)
- developer mode added (easy to find x/y coordinates)
- tooltip rewritten to support any data (ex. youtube videos)
- tooltip dynamic width
- tooltip dynamic height (with scrollbar if needed)
- smart tooltip positioning
- fullscreen button added
- search feature improved
- SVG tutorial included
- hover tooltip added
- pin animations added
- ajax preloader added
- new flat design
- source code improved and greatly optimized
- and many more
Version 1.0.1 - December 8th, 2013
- minimap click event fixed
- responsivity bug fixed (list and search shown on mobile devices)